Dashboard
The Dashboard is a fleet-wide view: how many runs and jobs are in each status band, which rules misbehave across projects, and (when enabled) coarse server health.
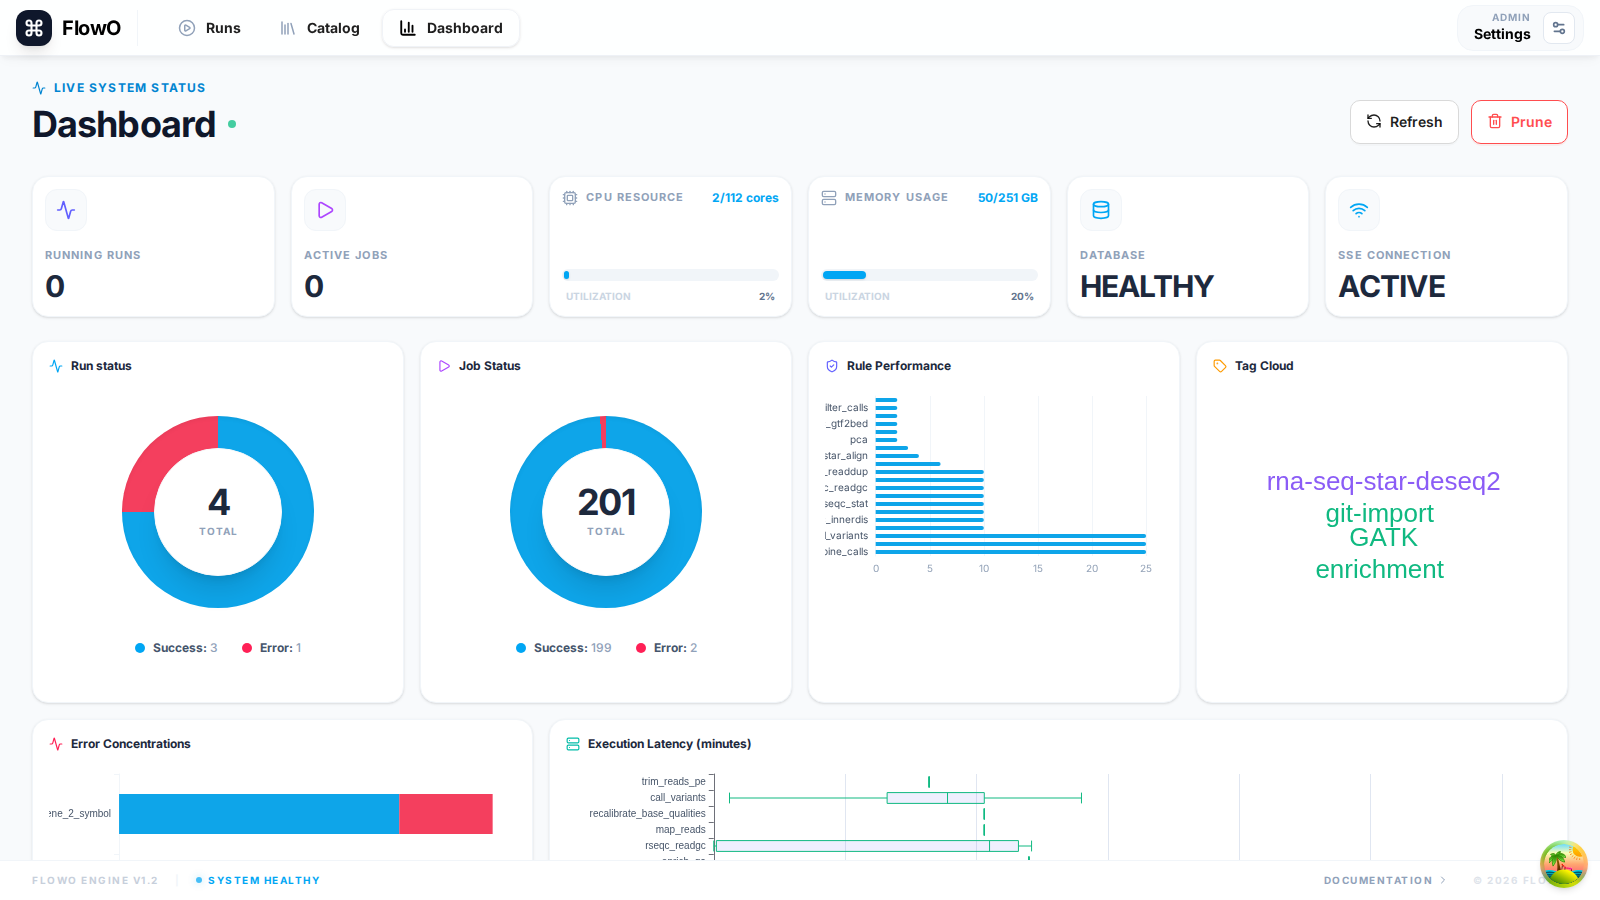
Overview Cards
At the top of the dashboard, you'll find summary cards for: - Total Workflows: Total number of runs recorded. - Total Jobs: Total number of individual tasks executed across all workflows. - Rule Errors: Count of unique rules that have failed recently. - System Health: Indicates the connectivity status of the backend and real-time event stream.
Activity Charts
The dashboard features interactive charts to visualize your throughput: - Workflow Activity: A timeline showing when workflows were started and finished. - Job Distribution: A breakdown of job statuses (Success, Running, Failed, Queued).
Recent Runs
A quick-access list of the most recent workflow executions. This allows you to jump directly into the details of an ongoing or recently completed run.
Rule Statistics
This section highlights the most frequently executed rules and those with the highest failure rates, helping you identify bottlenecks or unstable parts of your pipeline.
System Resource Summary
If enabled, the dashboard also displays aggregate resource usage (CPU, Memory) for the server hosting the FlowO backend and any connected execution nodes reported by the logger.